Summary
A community-informed reliability and accessibility platform for LA Metro Rail that combines live service data with rider reports to show whether a line or station is dependable and accessible right now and historically.
The platform should answer: "Can I trust this trip to work?"
Official transit data can show vehicle locations, delays, scheduled stops, and cancellations. However, it may not fully capture:
- Broken accessibility equipment
- Unexpectedly inaccessible stations
- Severe crowding
- Trains passing without stopping
- Unsafe or difficult transfers
- Description
- Service information that does not match reality
- Whether another rider actually completed the trip successfully
Notes
We will begin with just LA's Metro Rail, which keeps the project manageable while preserving the strongest technical and social-impact aspects.
The primary audience will be regular LA Metro riders, particularly riders making time sensitive trips and those with mobility or accessibility needs. Secondary users may include researchers and community organizations interested in understanding differences between scheduled service and riders’ actual experiences.
Data
Most of the data lives here. It updates every minute along with weekly calendar updates.
We need to ensure that we can run cron jobs or scheduled scripts to actively pull this data.
Community-generated Data:
- Incident type
- Line
- Station
- Date and time
- Severity
- Description
- Accessibility Score (optional)
- Image (optional)
Derived Data:
- Average delay by line and time
- Cancellation frequency
- Recent report count
- Percentage of confirmed reports
- Accessibility incident frequency
- Reliability score (could have a small model)
- Confidence level based on data quantity
- Most problematic stations or periods
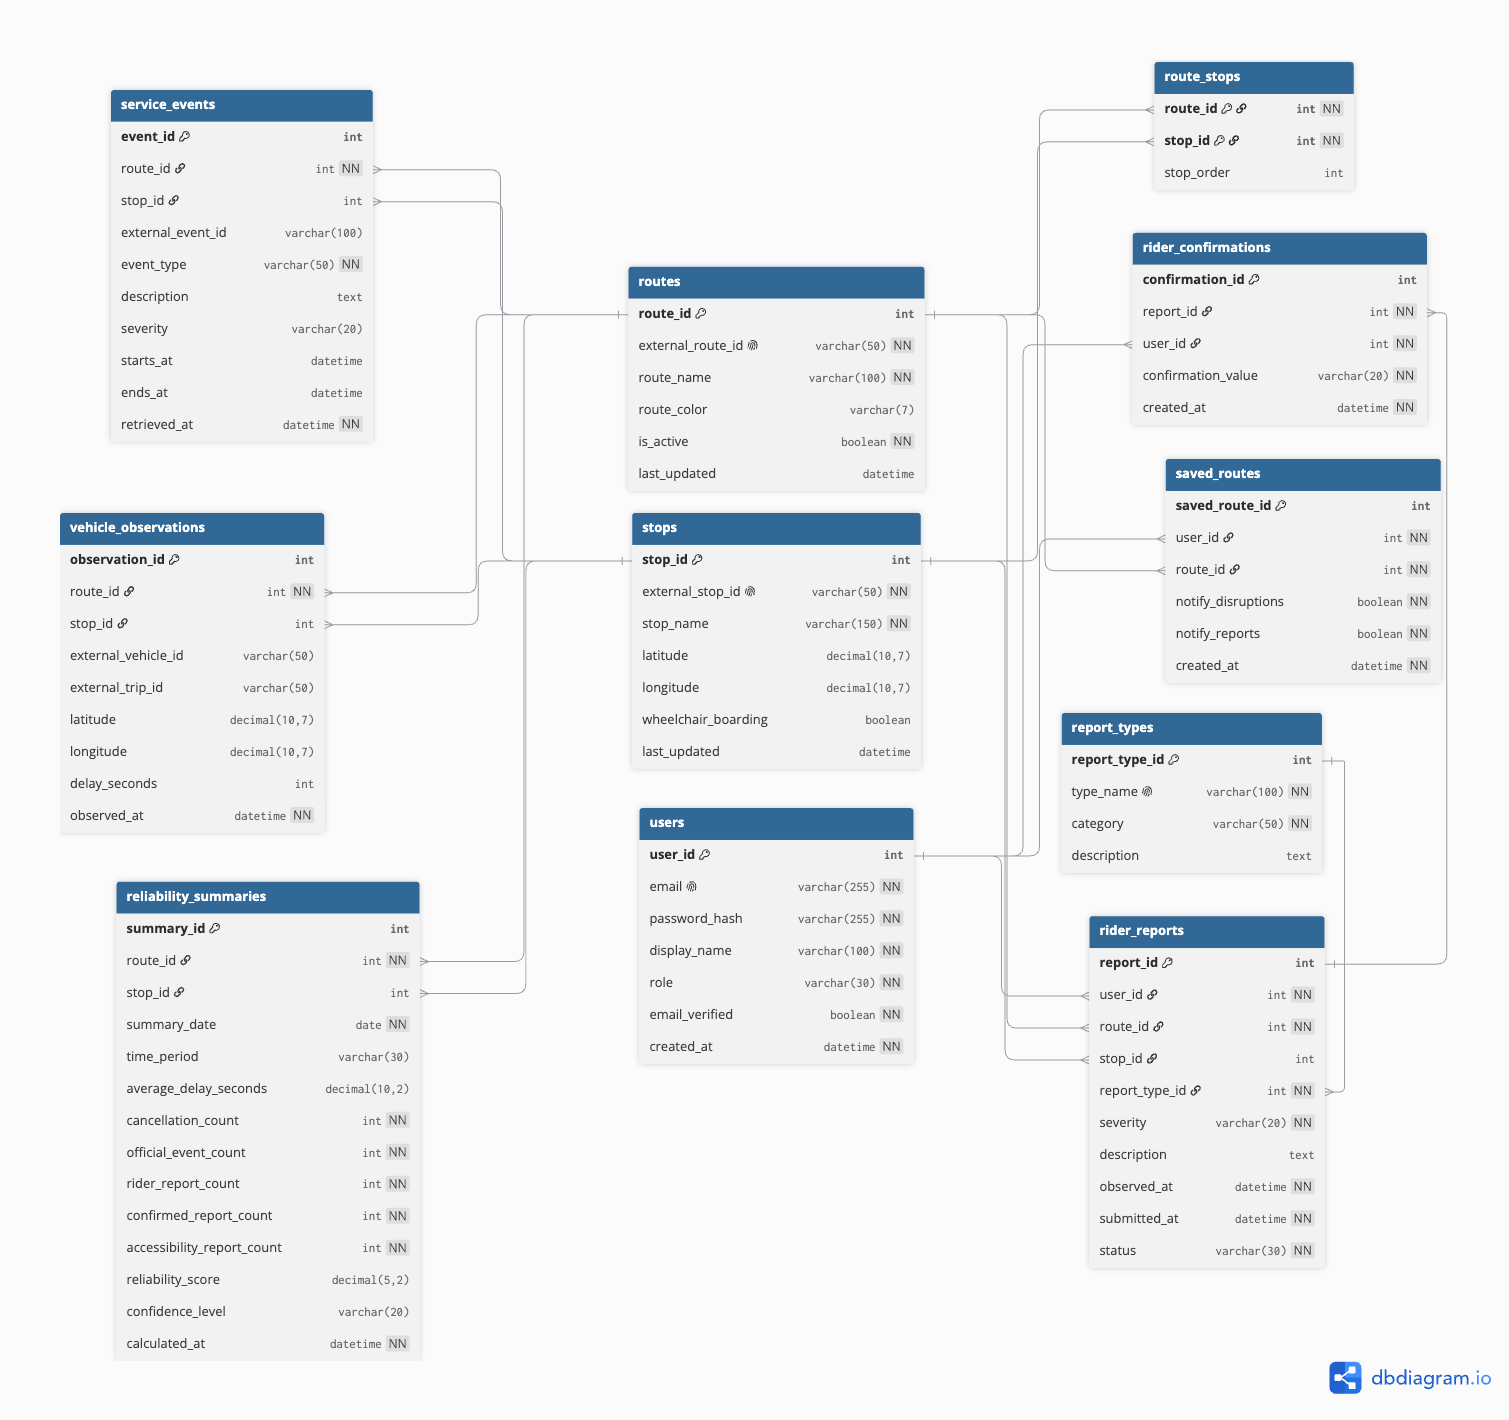
Data Diagram